How to Properly Create Revenue Projections
Using Weighted Averages and Clean Categories to Craft Defensible Revenue Projections within Business Constraints
Let’s be real: your financial model is everything when applying for an SBA loan or pitching to investors. It’s a window into how you think about your business, understanding how different parts of your company work together and influence each other.
Revenue projections are critical. Getting them right is vital for cash flow, inventory, and hiring. These projections are integral to every aspect of your business planning.
A strong revenue projection recognizes the constraints your business faces and identifies the key revenue drivers that closely correlate with those constraints. You need to understand both.
This approach shows financiers how your mind works and creates assumptions that guide your business decisions and growth strategy. We’ll dive into how to pinpoint your business’s constraints and use dynamic drivers to make your revenue projections realistic and useful.
Revenue projection is estimating how much money your business will generate over a certain period based on assumptions about future sales, costs, and market conditions. It helps set realistic and achievable financial and operational objectives.
Every business faces constraints – capacity limits or bottlenecks that define the maximum output or service delivery possible within a given time period.
Identifying constraints can be simple for some businesses, like a moving company where staff, miles driven, packing time, and vehicle availability impact capacity limits. For others, it can be complex, requiring frameworks like Dependency Mapping to understand bottlenecks in supply chains, manufacturing, or service delivery.
Aiming for a solid understanding of constraints, even if not 100% accurate, puts you ahead of most new businesses.
Time scales also play a critical role in understanding and planning around constraints. Different businesses operate on varying time scales, influencing how constraints are managed and revenue projections are structured.
Restaurants often consider constraints daily or by meal period, estimating capacity based on table turns during lunch and dinner services. Homebuilders operate on a longer time scale, with constraints like availability of construction materials, labor, and permits influencing how many homes can be built and sold within a timeframe.
Dynamic Drivers in Revenue Projections
It’s important to distinguish revenue projection from accounting; the former is about making educated guesses about the future, while the latter deals with recording past financial transactions. As a business matures and accumulates operational history, these projections become more informed and less speculative. However, in the early stages, there’s inherently more guesswork involved. Yet, this doesn’t mean the process should lack rigor or method.
Cost of Goods Sold (COGS) and Market Data
One of the first steps in making your revenue projections as accurate as possible is understanding COGS. This involves a thorough examination of the fundamental costs associated with creating and delivering your products and services These costs can include raw materials, direct labor, and other essential costs. For a more in-depth understanding, here’s a link to Core Cost Analysis, which can be found on Businessplan.com, offering valuable insights into structuring this analysis effectively.
Furthermore, leveraging competitor pricing and industry data can significantly inform your revenue projections. For example, in the restaurant industry, organizations like the National Restaurant Association provide crucial data on average costs and industry benchmarks, such as the fact that the cost of goods sold (COGS) related to food costs typically averages around 33%.
Keeping Revenue Projections Clean and Adjustable
A key principle in revenue projection is to keep your forecasts clean, readable, and adjustable. This means structuring your projections in a way that they can be easily understood and modified as new information becomes available or as circumstances change. Simplicity in design allows you, and potentially investors or lenders, to quickly grasp the financial outlook of your business and make informed decisions.
Linking Revenue Drivers to Constraints
Equally important is the alignment of your top-level revenue drivers with the main constraints of your business. Revenue drivers are the key factors that directly influence your business’s ability to generate income. Identifying and closely linking these drivers to your business’s constraints ensures that your revenue projections are not only grounded in reality but also reflect the operational limits of your business.
For instance, if the main constraint for a restaurant is the number of seats available, then a primary revenue driver could be the items they would purchase during a specified meal time. By focusing on optimizing these drivers within the context of the restaurant’s seating capacity, you can develop more realistic and actionable revenue projections.
Readable Line Items in Revenue Projections
Achieving the right balance in detailing your revenue projection is more of an art than a science. For businesses with a straightforward product line or service offering, such as those selling a single product or offering one type of membership, maintaining clarity and readability in revenue projections is straightforward. However, this task becomes significantly more complex for businesses with a diverse array of products and services (most of us). The challenge lies in creating a revenue projection that is detailed enough to be useful and credible but not so detailed that it becomes unwieldy or invites unnecessary scrutiny.
Avoiding Over-Complexity
Consider a retail store with a wide range of inventory items. If you were to list each item individually—every t-shirt, dress, pair of shoes—you would end up with an extensive list of revenue and direct cost of revenue items. This level of detail not only makes the projection nearly impossible to manage in any meaningful way but also raises questions you might not be ready or able to answer accurately. For instance, being asked, “Why do you expect to sell $5,000 worth of blue Lacoste men’s polo in size large?” can lead you into speculative territory.
Striking the Right Balance
The goal is to find the “Goldilocks zone” of detail in your revenue projection—enough detail to make your assumptions credible and your financial model useful, but not so much that it becomes a distraction or a liability. This involves grouping similar products or services into categories and focusing on key line items that are logically tied to your business’s constraints. For a retail store, this might mean categorizing inventory by type (e.g., apparel, footwear) or by demographic (e.g., men’s, women’s, children’s) rather than itemizing every product.
Utilizing Weighted Averages and Other Strategies
One effective strategy to manage the variability within these categories is the use of weighted averages. This approach allows you to estimate revenue and costs based on average prices and costs across a category, rather than trying to predict the performance of individual items. Weighted averages can help smooth out the volatility inherent in sales and cost figures, providing a more stable and manageable foundation for your revenue projections.
Moreover, tying your revenue line items closely to your identified constraints ensures that your financial model remains grounded in the operational realities of your business. For example, if the main constraint for a service-based business is the number of clients it can serve in a day, then revenue projections should be built around this as an ultimate target or limiting factor, using average revenue per client or service as a key line item.
Case Example: Revenue Forecast for a Family Restaurant
In the business of dining, every seat and every meal period can count towards your bottom line. To craft a solid revenue projection for our family restaurant example, we must examine the constraints of our operations and align them with realistic revenue drivers. We will see how this unfolds in the tables provided below, which offer a clear view of our forecasting approach.
Understanding Capacity and Projecting Revenue
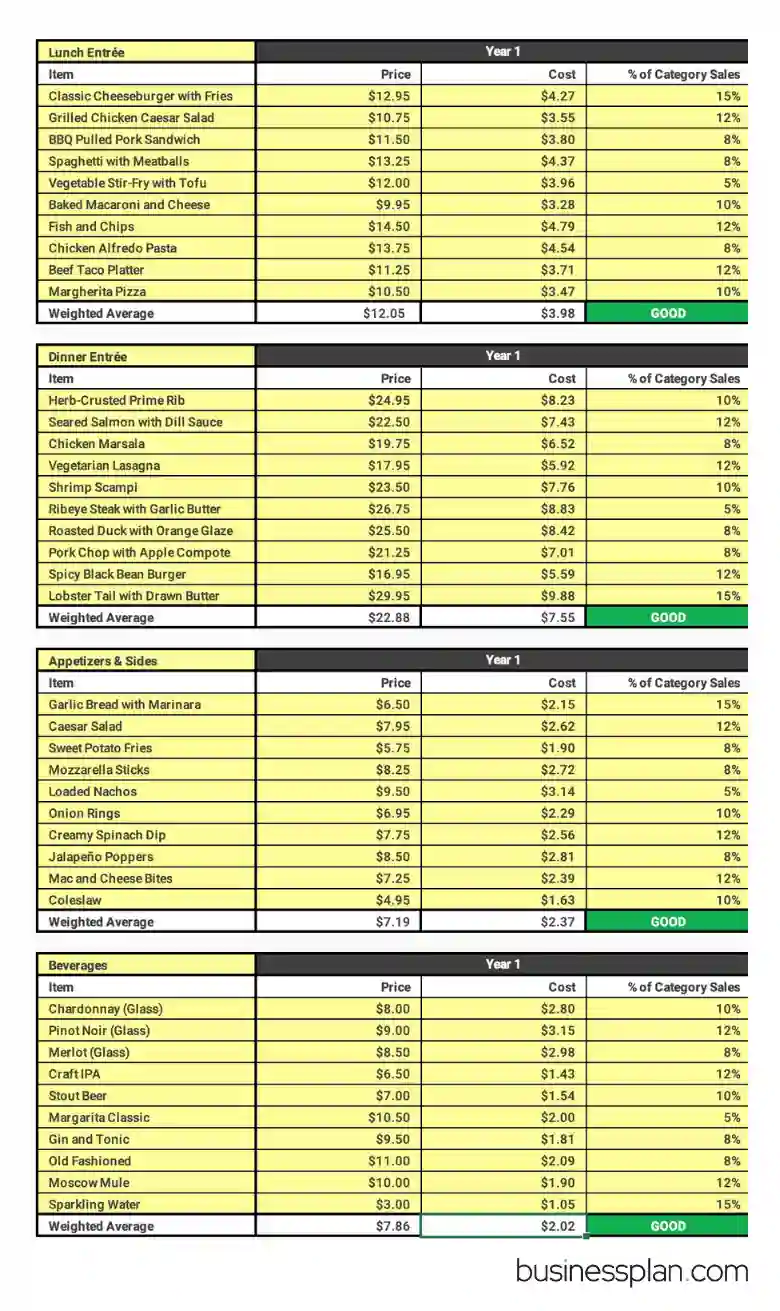
Our example restaurant boasts 100 seats. With expectations of two table turns during lunch and three during dinner over a five-day work week, the arithmetic of our capacity becomes clear. Over a year of 260 operating days, our lunch service offers a total of 52,000 seats, while dinner offers 78,000. By applying the weighted average ticket price—$12.05 for a lunch entrée and $22.88 for a dinner entrée—our maximum revenue potential for entrées for the year could soar to $2.5 million if every seat were filled and every guest ordered an entrée at every opportunity.
In the first table below, the weighted averages for each menu category—Lunch Entrée, Dinner Entrée, Appetizers & Sides, and Beverages—are determined based on the price, cost, and projected percentage of category sales.
This level of detail offers an informative view of potential earnings per patron and aids in decision-making for menu pricing and cost management.
Realistic Revenue Targets
Given the ebb and flow of weekly business, achieving maximum capacity consistently is unlikely. A more realistic scenario might see the restaurant reaching approximately 70% of total seat capacity, ordering one entree each, on average. With this assumption, we can set a revenue target that is both ambitious and believable to a banker or investor. This leads us to a combined revenue target for lunch and dinner entrees of around $1.7 million for the mature years, like the third or fourth year of operation.
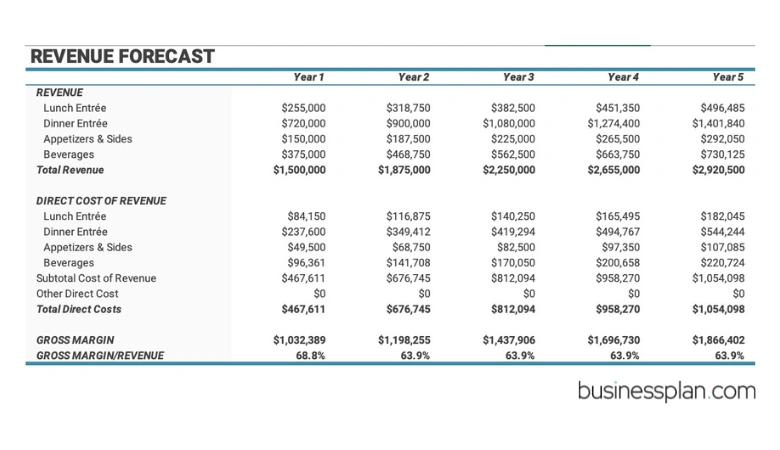
In the second table below, we see the annual revenue and direct cost of revenue projected over a five-year period, demonstrating how the restaurant’s revenue is expected to grow, maintaining alignment with our constraints and seating capacity.
These projections use our weighted averages and capacity constraints as a foundation, allowing us to foresee a steady increase in revenue and manage direct costs effectively. It’s a clean and tidy representation that tells a story of growth based on realistic and defensible assumptions.
Expanding Beyond Entrées
With our baseline sales of lunch and dinner entrées established, we can project additional revenue streams from beverages and appetizers. Each patron occupying a seat represents not just an entrée but the potential for a full dining experience, which includes drinks and side dishes. By leveraging our baseline entrée sales, we can estimate additional revenue from these categories, enhancing the overall financial health of the restaurant.
These tables provide a clear example of how a family restaurant can use its operational constraints to form a defendable revenue projection. The key is to keep the forecast realistic, defensible, and aligned with both the restaurant’s capacity and the typical customer behavior patterns. It’s a simplified model, yet it captures the essence of the financial foresight necessary for effective business planning.
To summarize, a well-orchestrated revenue projection is about projecting numbers and narrating the potential of your business. It’s an essential section in your business plan that, when developed with thoughtful consideration of constraints and drivers, can become a compelling argument for financing and a reliable guide for goal setting and growth. The key takeaway is to ensure that your revenue projections are not isolated figures but are deeply interconnected with every aspect of your business strategy.
If you find yourself wrestling with the complexities of structuring product categories or setting constraints for your projections, remember that this is a common hurdle in business planning. Do not hesitate to seek advice. I encourage you to reach out via our X community, LinkedIn, or Substack with your strategies and questions. While I offer professional consulting services, your query might just be the perfect candidate for a quick tip or even a feature in an upcoming article.
For those who’ve already presented to a bank or pitched investors, your experiences with revenue projections are invaluable. I invite you to share your stories—both the triumphs and the trials. What categories did you focus on? How did you determine your constraints? Every business journey is unique, and by sharing yours, you contribute to a collective wisdom that can enlighten and inspire others.
For those who are keen to dive deeper into the world of financial modeling and business planning, stay tuned for upcoming resources and workshops. These will be designed to sharpen your skills and enhance your understanding, giving you the tools to craft projections that truly reflect the heartbeat of your business.


